This is a very simple how-to about profiling python scripts using python's built in cProfile and KCacheGrind to visualize profiling data.
Gathering profiling data
Let's assume we have a script called test.py, its content can be for example
very simply this:
import time

for _ in range(10):
    time.sleep(1)
Now, to profile this code, we call python with the cProfile module:
python3 -m cProfile -s time -o test.prof test.py
If you call this without the -o flag, you'll get the profiling data
printed in your terminal:
13 function calls in 10.011 seconds

Ordered by: internal time

ncalls  tottime  percall  cumtime  percall filename:lineno(function)
    10   10.011    1.001   10.011    1.001 {built-in method time.sleep}
     1    0.000    0.000   10.011   10.011 test.py:1(<module>)
     1    0.000    0.000   10.011   10.011 {built-in method builtins.exec}
     1    0.000    0.000    0.000    0.000 {method 'disable' of '_lsprof.Profiler' objects}
KCacheGrind cannot read this file. We need to convert it into a cachegrind
format. To do that, we can use pyprof2calltree
(pip install pyprof2calltree). Simply do:
pyprof2calltree.py -i test.prof -o cachegrind.out
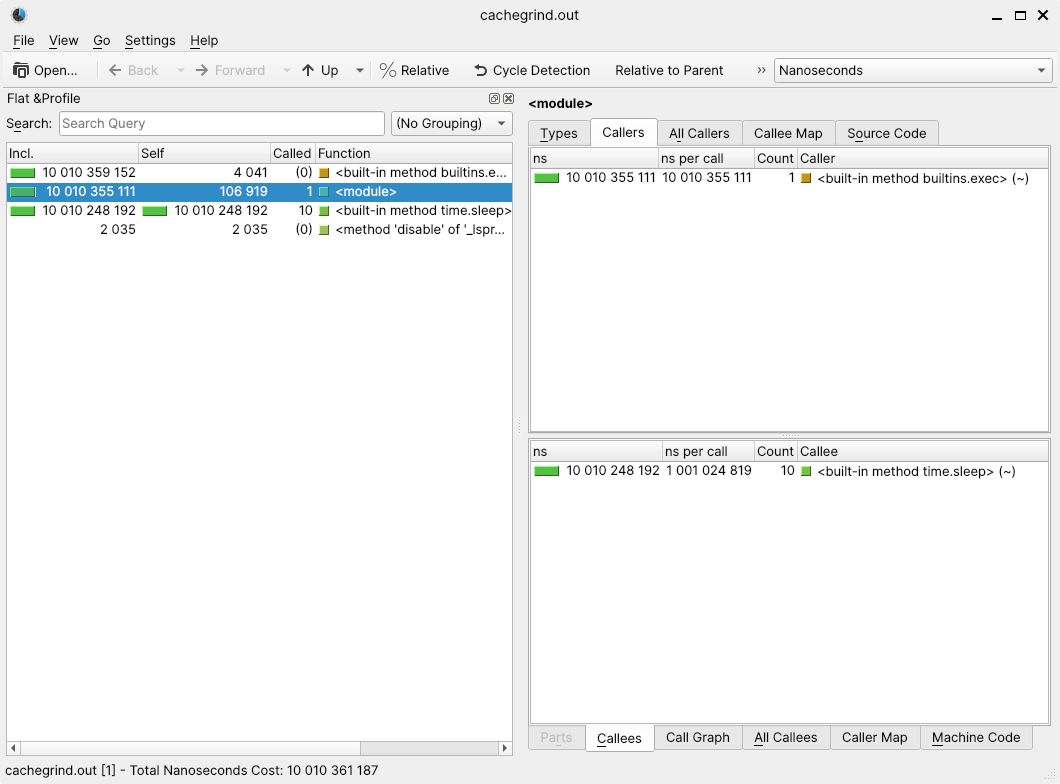
Now we are able to open this in KCacheGrind and get a nice output and interactively explore our script, which function calls what, how many times and how much time is spent there.
To make the profiling simpler, I made a tiny bash script to automate these steps:
py3profile.sh:
#!/usr/bin/env bash

TIMESTAMP=$(date +"%s")
python3 -m cProfile -s time -o /tmp/profile_$TIMESTAMP.prof "$@"

if [ -e /tmp/profile_$TIMESTAMP.prof ]
then
    pyprof2calltree -i /tmp/profile_$TIMESTAMP.prof -o /tmp/cachegrind.out.$TIMESTAMP
    kcachegrind /tmp/cachegrind.out.$TIMESTAMP
    rm /tmp/profile_$TIMESTAMP.prof
fi
Profiling Django views
To debug Django views, we first need to install
django-extensions and enable it.
Just add django_extensions in your INSTALLED_APPS.
This adds a profiler server for local development that will gather profiling data. Since we are interested in using KCacheGrind, the command will look like this:
./manage.py runprofileserver --kcachegrind --prof-path <path to cachegrind files>
(default path is /tmp and the destination folder has to exist, otherwise
the server will complain). This also enables the --cprofile argument.
Now we get all we need to explore the profiling data with KCacheGrind. You can expect a little bit more function calls before the execution reaches your views.